The Private Credit Radar: what it is, what it shows, and what comes next
Where does stress in private credit show up before a borrower stops paying? The Private Credit Radar answers that question every quarter, from data anyone can check: it reads the loan books of every US business development company (BDC) that files with the SEC and reports six indicators of credit stress, from valuation marks through payment relief to non-accrual. I released version 1.0 on 2 November 2026. This post says what the radar is, what the first edition shows, who should work with it, and what comes next.
What it is
Stress in private credit is absorbed long before a borrower stops paying: the lender switches interest to payment-in-kind (PIK), extends the maturity, steps up the spread, marks the loan down, and only at the end puts the loan on non-accrual. Default rates count that end. The radar reads the stages before it, loan by loan.
The material is the schedule of investments in every 10-Q and 10-K that a BDC files on EDGAR. Version 1.0 covers 162 funds run by 88 managers, 36,687 funded debt positions at 7,139 borrowers and USD 499bn of principal at 30 June 2026, at fourteen quarter-ends since March 2023. Each position is followed from quarter to quarter (the matching model reaches 99.8% precision and 99.2% recall on 2026 filings held out of its training), and each borrower carries one identifier across all funds, so a company held by five lenders is seen once and the five marks can be compared. Every indicator is published for all funds, for a constant panel of the 87 funds present at every quarter-end, and for listed and non-traded BDCs separately. The constant panel matters: funds that entered after 2023 hold younger loans marked higher, so the all-fund series can fall without a single loan improving.
The six indicators, in the order the site presents them:
- Marked below 90 (and below 80): the share of positions whose fair value is below 90% of principal.
- Markdown breadth: positions marked down five points or more in the quarter.
- Cross-manager mark gap: borrowers held by two or more managers whose marks differ by five points or more.
- PIK switch rate: loans that switched from cash interest to PIK in the quarter.
- Distress amendments: a PIK switch, spread step-up or maturity extension at a borrower not yet on non-accrual, split by whether the position is also marked below 90 or marked down.
- Non-accrual: debt at cost on which the fund has stopped accruing interest.
Every number comes from public filings; no supervisory data of any kind enters. Fund-level figures name the fund and its filing; no borrower is named. I built the radar with three research assistants and a pipeline that reads the filings, and the method is public, so every figure on the site can be rebuilt from EDGAR.
Why I built it
Europe publishes nothing comparable. European lenders issue no schedule of investments: no marks, no PIK share, no record of a loan going from performing to stressed. The one European default series is a subscription product reported by the lenders themselves. Private credit is around USD 2 trillion by the industry’s own estimates, and European insurers, pension funds, banks and family offices have bought it for ten years without a public loan-level measure of what they own. The ones I meet at practitioner events read US BDC filings by hand, fund by fund, for orientation. When I ask those rooms for the main risk in private credit, “lack of data” ranks first.
The product is also reaching people who did not hold it until recently. ELTIFs, evergreen funds and semi-liquid vehicles put private credit in front of wealth clients and smaller institutions, and the AIFMD II loan-origination rules apply from April 2026. Every one of those products now needs a stress measure next to it, and nobody publishes one.
The research needs it too. I have spent twenty years on bank balance sheets: credit lines, syndicated loans, the European banking sector through 2008 and 2012. The leveraged lending that banks used to hold is now held by funds that report to their investors and to nobody else, and my work with my co-authors shows what that does to firms: because nonbank credit carries rollover risk, banks ration the credit lines of borrowers who depend on it, withdrawing liquidity insurance precisely when it is most valuable. The next stage of that research needs a measure of where the stress is. For the US the measure can be built from public filings. For Europe nobody has built one.
What the first edition shows
One in ten loan positions is marked below 90. At 30 June 2026, 10.3% of positions were marked below 90% of face value, up from 7.7% a year earlier; by principal they carry 8.3% of the book, about USD 41bn. The share marked below 80 rose to 5.9% from 4.4%. On the constant panel the share below 90 rose to 11.5% from 8.2%, so new funds do not explain the rise. Listed BDCs mark 12.8% of positions below 90 and non-traded BDCs 9.3%; where a listed and a non-traded fund hold the same borrower’s first lien, they mark it the same, so the gap comes from the loan books, from the age of the funds and from the loans only the listed houses hold. The jump came in the first quarter of 2026, when 6.6% of positions were marked down five points or more in a single quarter, the broadest markdown in the series. In the second quarter the marks paused: 10.33% to 10.26%.
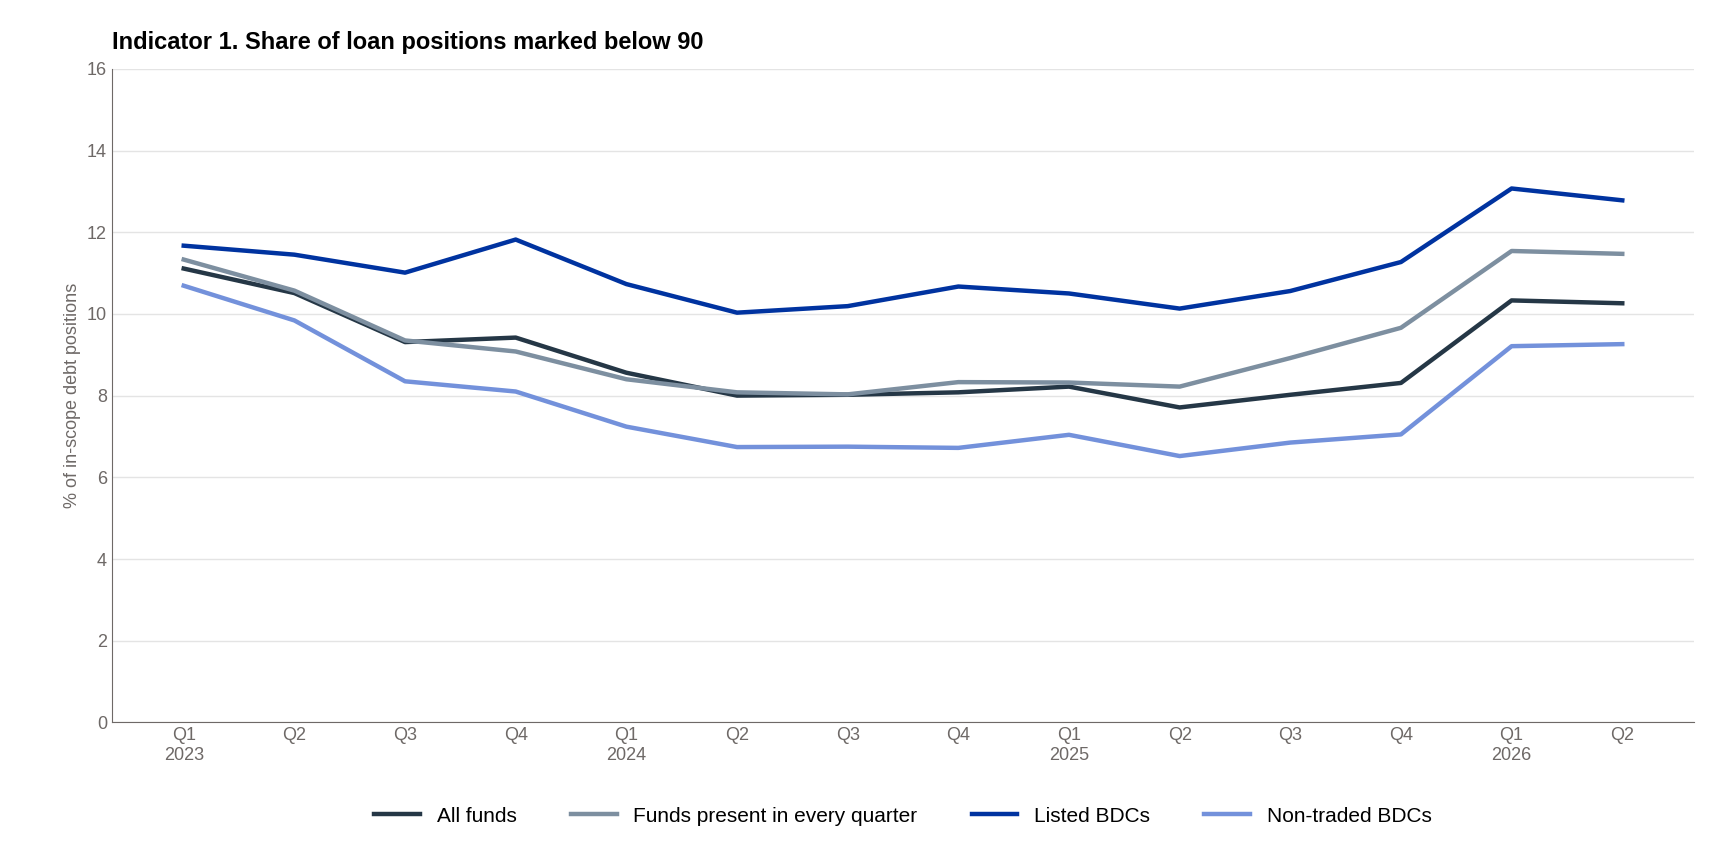
Figure 1. Share of loan positions marked below 90, all funds, constant panel, listed and non-traded BDCs, 2023 Q1 to 2026 Q2. Source: Private Credit Radar, version 1.0; SEC EDGAR schedules of investments.
Relief rose on the year while the marks paused. In the second quarter of 2026, 1.44% of loans switched from cash interest to PIK, against 1.15% a year earlier; on the constant panel the rate was 1.63%. Distress amendments rose to 0.53% of positions from 0.40%, and other amendments to 2.74% from 2.11%. Both amendment series rose quarter on quarter while the share below 90, the share below 80 and markdown breadth all eased. This is why the radar reports the relief stages on their own: a lender that extends a maturity and switches to PIK need not mark anything down.
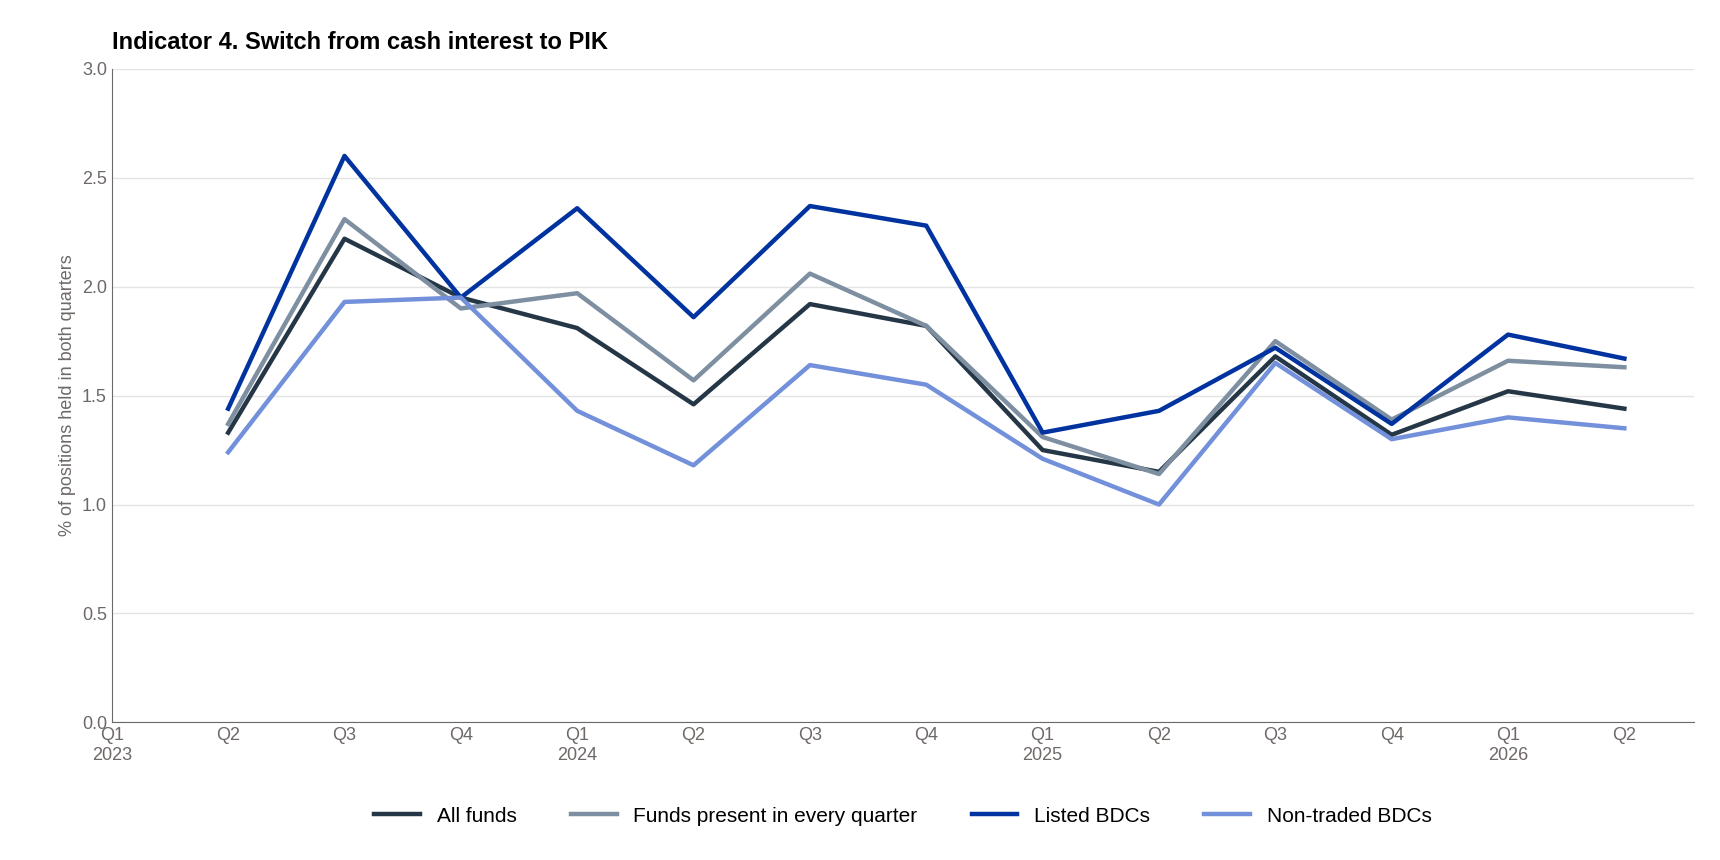
Figure 2. Share of loan positions that switched from cash interest to PIK in the quarter, positions held in both quarters. Source: Private Credit Radar, version 1.0; SEC EDGAR schedules of investments.
Non-accrual, the end of the process, reached 1.84% of debt at cost, up from 1.29% a year earlier and down from 1.95% in the first quarter. Listed BDCs carry 3.8% of their debt at cost on non-accrual, non-traded BDCs 1.1%; on the constant panel the rate is 2.1%, up from 1.4%. The rate is computed position by position from the schedules and lands within 6% of the rates the funds disclose themselves, which is the check that the reading is right.
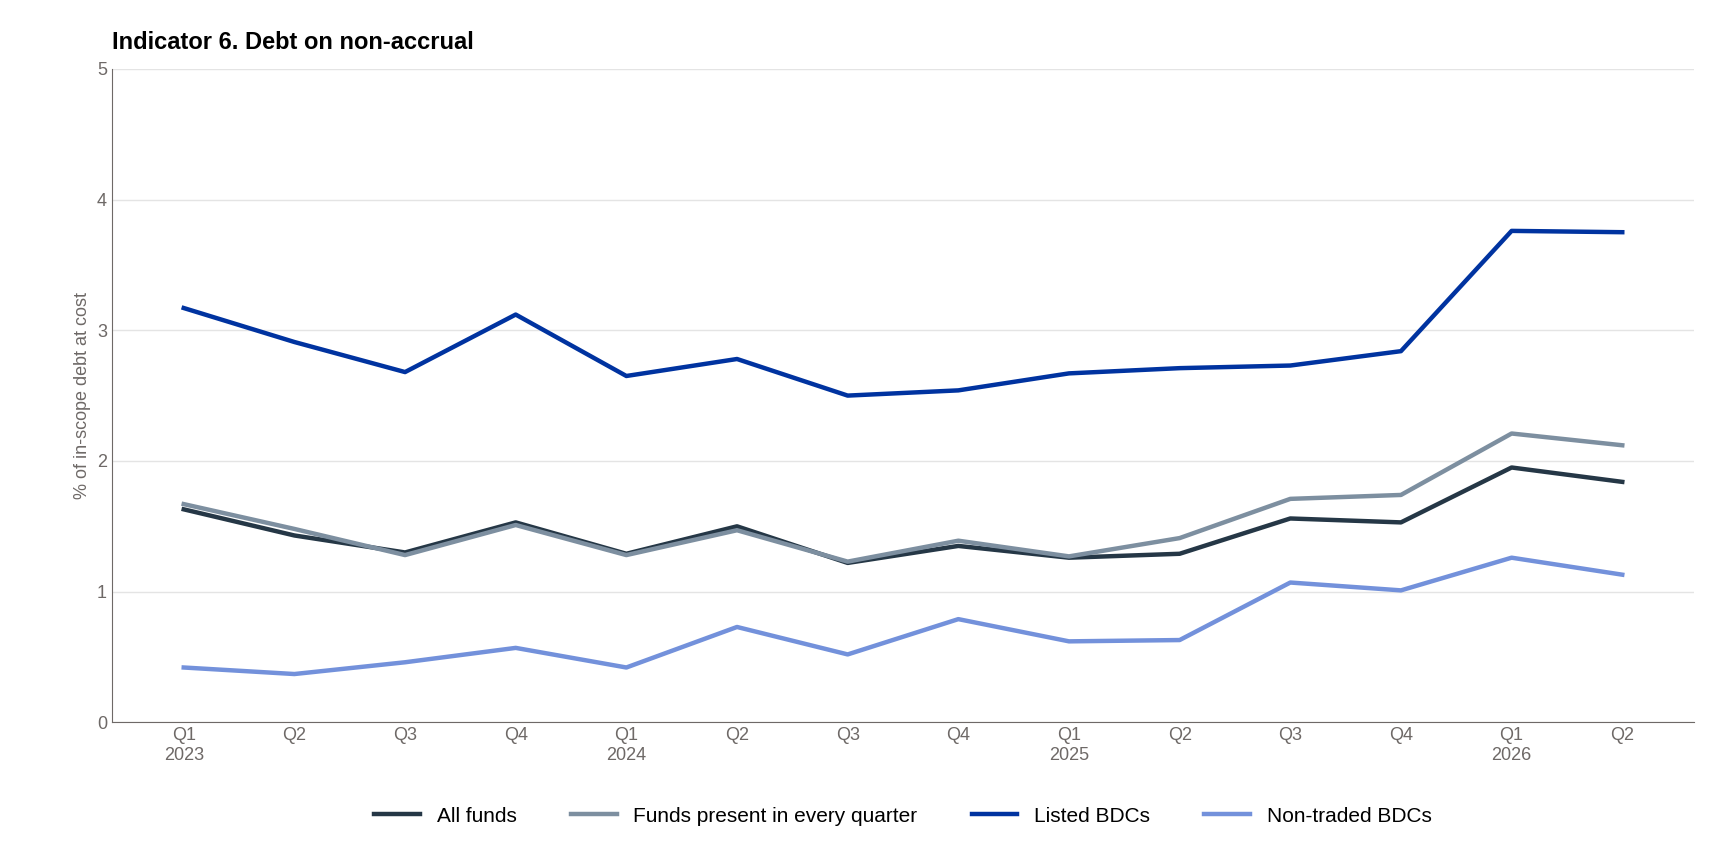
Figure 3. Debt on non-accrual as a share of in-scope debt at cost. Source: Private Credit Radar, version 1.0; SEC EDGAR schedules of investments.
The dashboard
Everything on privatecreditradar.eu is free to read: the six indicator cards below, one page per indicator with the series by fund group, its definition, how to read it and the full fourteen-quarter table, and the note on data and method. The indicator series download as a CSV file after registration. Release alerts are one email per release and nothing else.
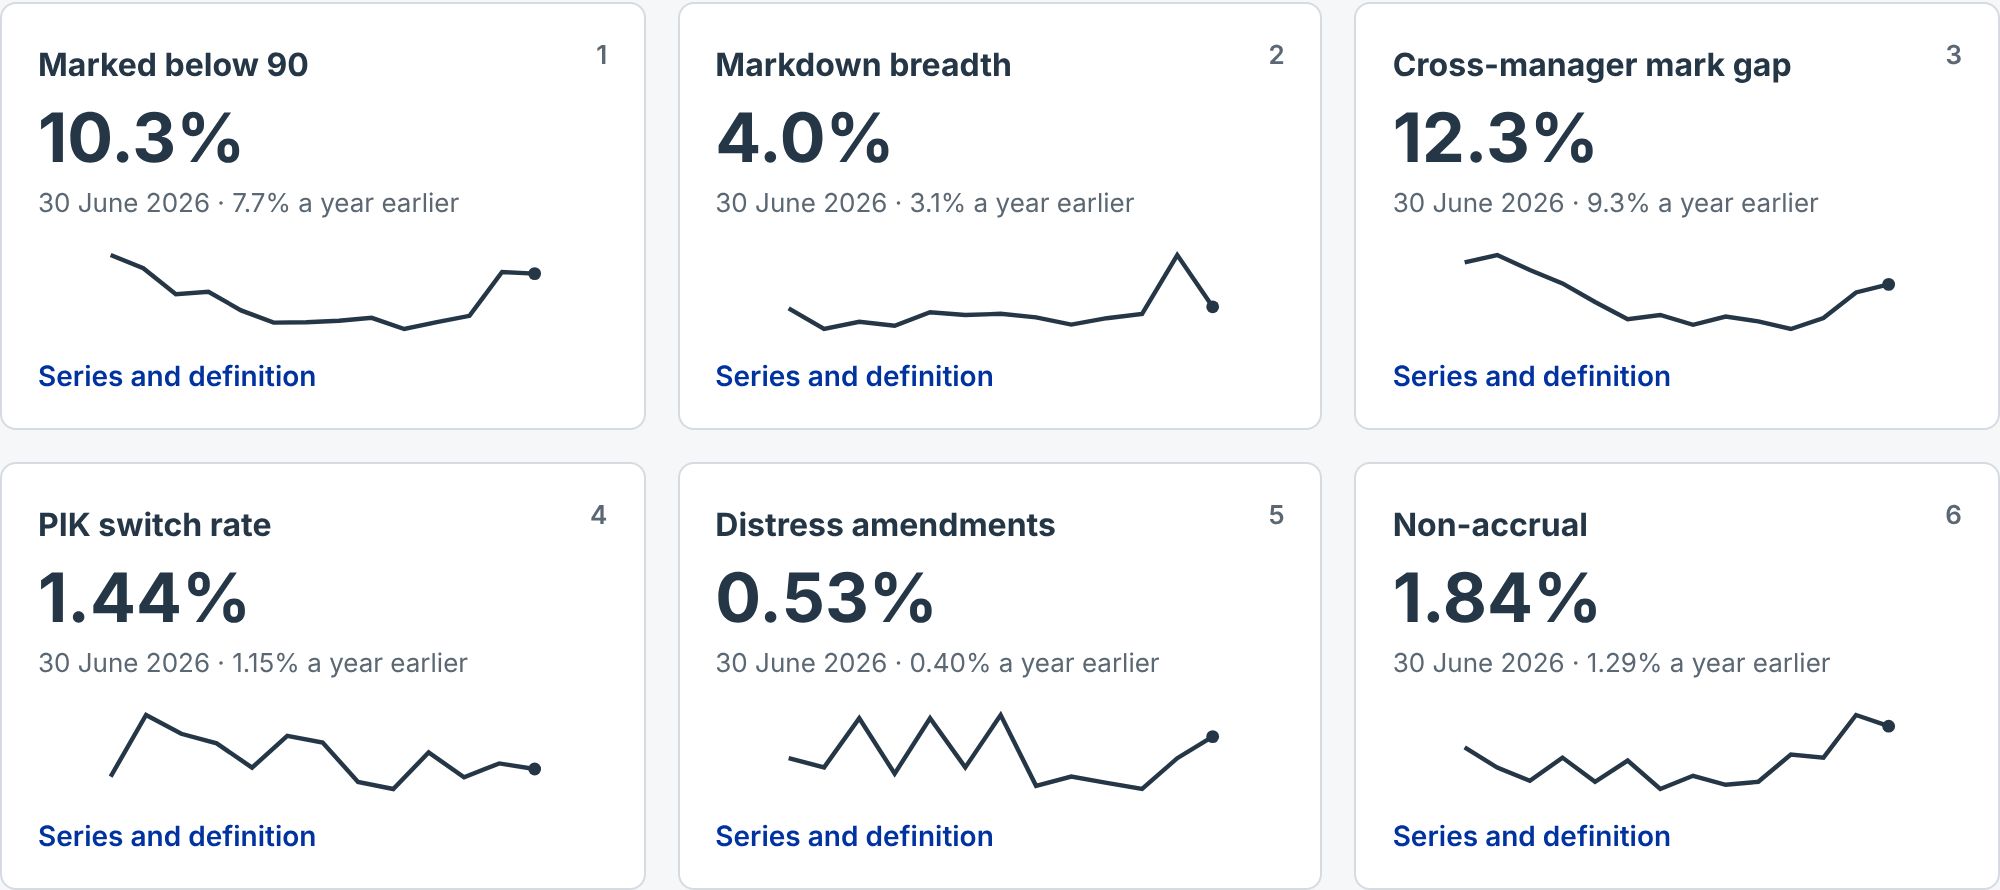
Figure 4. The six indicator cards on privatecreditradar.eu, readings at 30 June 2026 with the year-earlier value and the fourteen-quarter series. Snapshot of 8 November 2026.
Who should work with it
Investors in private credit have had no stress measure to put next to the product: insurers, pension funds, family offices, and the wealth platforms that now distribute ELTIFs and evergreen funds. The radar gives them one. A fund’s own PIK share, amendment rate and non-accrual can be read against the market and against the constant panel, every quarter, with the definition next to the number.
Fund managers and their valuation committees can compare their marks with those of the other lenders to the same company. At 30 June 2026, 12.3% of borrowers held by two or more managers carried marks five points apart, up from 9.3% a year earlier.
Banks lend to the funds and to the same borrowers. The borrowers under stress are the ones who draw their undrawn commitments, and the bank that provides the fund’s credit line carries that draw one step removed. The liquidity flash in January puts that exposure next to the credit indicators.
Supervisors and central banks get a public series with fixed definitions. A threshold does not change between releases without a note stating the change and its effect on the history, revisions appear on the errata page with their size, and anyone can rebuild the series from the filings.
Journalists and analysts get one source: one number per indicator, the definition beside it, the full series behind it. The six charts on the press page can be reused unchanged with the source line.
Students in my courses and the participants of my executive programmes on private credit work with the radar’s own numbers. The questions a loan-level panel can answer are the questions I set.
What comes next
The series grows by one column every quarter, and the questions it can answer change with its length. After fourteen quarters we can say that most loans marked below 90 are still there a quarter later. After forty we can say what a markdown in 2026 implied for a loss in 2029, and whether the lenders who marked early were right. The calendar:
- 14 December 2026, the Q3 edition. The US book at 30 September 2026, and the European book: the 690 European companies in US BDC books at mid-2026, one borrower in ten, measured with the same six indicators, together with the European lender layer that public data allows. From this edition every release states the change since the last quarter next to the change on the year, and says which indicators ran against the year-on-year direction.
- January 2027, the liquidity flash. Undrawn commitments to borrowers already under stress, so that fund liquidity is read next to credit.
- 2027. A backfill to 2019, so the series carries a full cycle including 2020. Sector tags on the loan books, starting with data-centre and AI exposure. Deal terms at origination. Borrowers mapped to sponsors and countries. A seventh indicator, impaired exits, held back from version 1.0. A European lender-side window built from listed vehicles, ELTIF and fund reports and company registers, which is where the European book stops being a cut of a US product.
Updates come quarterly, about six weeks after the last BDC filing of the quarter.
Reading the radar, 10 November
I present the first edition in the webinar “Reading the Radar” on Tuesday 10 November 2026, 17:00 to 18:00 CET, online; registration is open. The Private Credit Radar partner programme funds the research behind the radar. Questions to radar@privatecreditradar.eu.
Cite as: Steffen, S. (2026). Private Credit Radar, version 1.0. privatecreditradar.eu.
private creditPrivate Credit RadarBDCdirect lendingvaluation marksPIKnon-accrualamendmentsfinancial stabilitynonbank financedata