Software: from the safest part of private credit to where the stress is building
Software loans explain almost half of this year’s rise in stressed US direct-lending positions. Counted by company, the picture is less dramatic, and more telling.
Where in the loan book did the stress of the past year come from? When I released the first edition of the Private Credit Radar on 2 November, the headline was that one in ten loan positions held by US business development companies (BDCs) is now marked below 90. That number tells you how much stress there is. It does not tell you where it is. So I cut the book by industry.
The short answer is software. The longer answer is that software is the largest single source of the rise, but it is not the whole story, and counted by company it is no longer an outlier.
A word on the measure first. A loan is “marked below 90” when the fund that holds it values it at less than 90 cents for every dollar of principal. Nothing has defaulted at that point, and the borrower may still be paying every coupon. But the lender’s own estimate of what the loan is worth, reported to the SEC every quarter, has fallen well below face value. It is one of the earliest public signs that a lender has stopped believing in par.
Software turned in a single quarter
At 30 June 2025, 6.3% of software and services positions in BDC books were marked below 90. Across all other positions the share was 8.1%. Software was, by this measure, the safer part of the book, and it stayed that way through 2025: at the end of December it stood at 6.4%.
Then it broke. By the end of March 2026 the share was 11.2%, and by the end of June 12.4%. The rest of the book deteriorated too, from 8.1% to 9.9% over the year, but nowhere near as fast. Across all positions in the industry cut, the share below 90 rose from 7.8% to 10.4%, a rise of 2.6 percentage points. Software accounts for 1.15 of them.
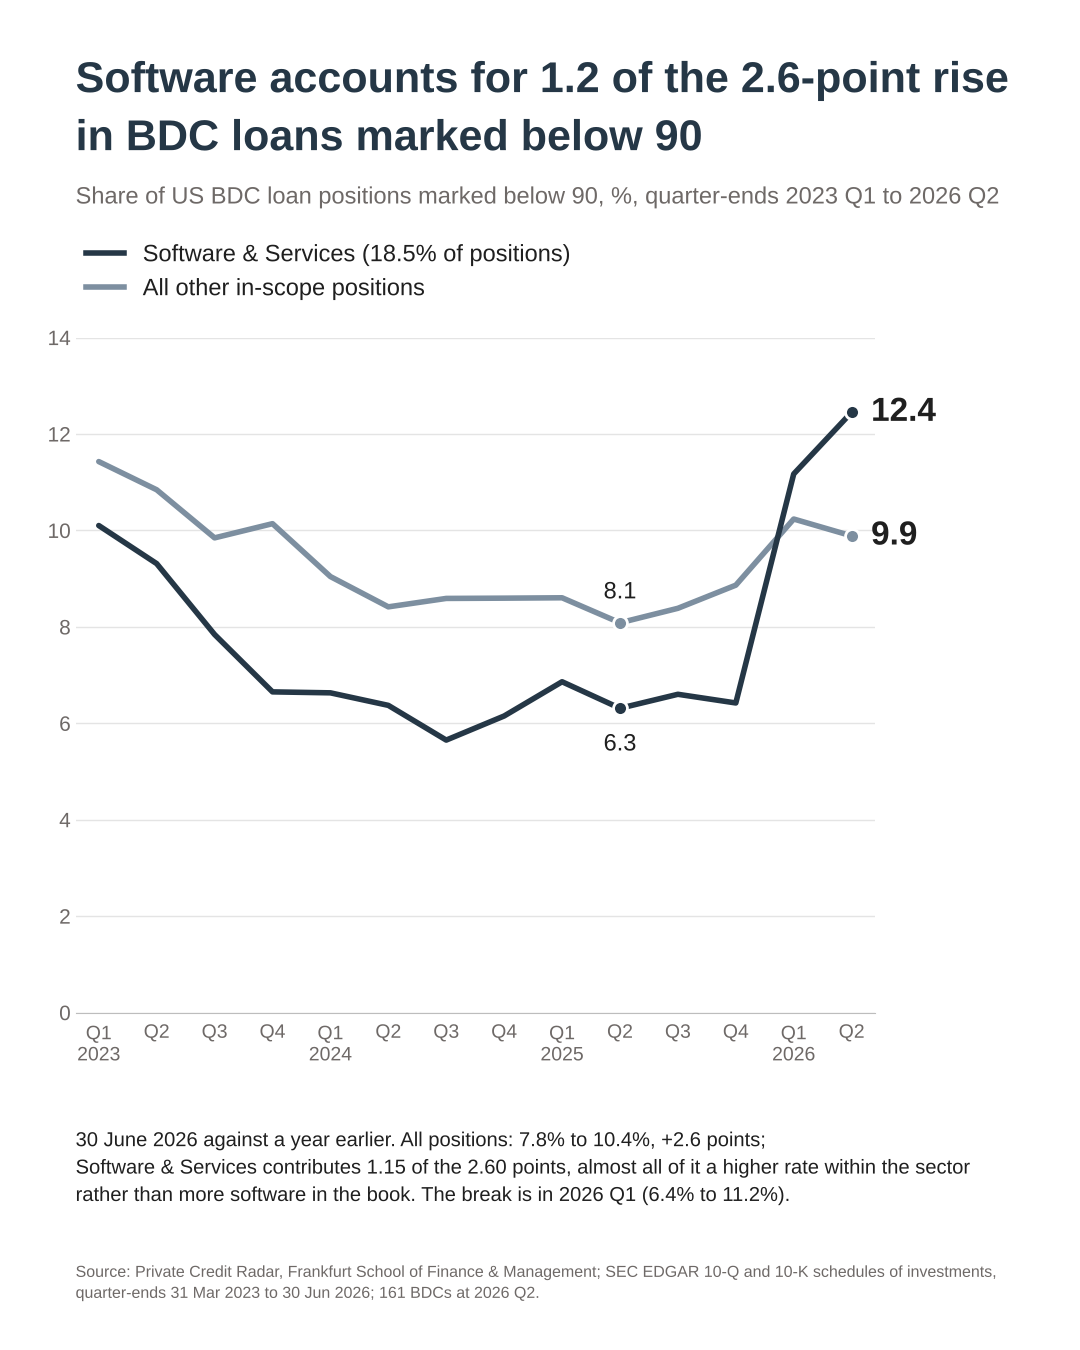
Figure 1. Share of US BDC loan positions marked below 90, Software & Services against all other in-scope positions, quarter-ends 2023 Q1 to 2026 Q2. Source: Private Credit Radar; SEC EDGAR 10-Q and 10-K schedules of investments.
What did not happen is just as important. Lenders did not pile into software. Software and services made up 18.2% of positions a year ago and 18.5% now, roughly one in five. Of software’s 1.15 points, 1.14 come from a higher share of software loans marked below 90 and only 0.02 from software being a slightly larger part of the book. This is software loans being marked down, not more software.
The timing matters. The first quarter of 2026 is also when the radar recorded the broadest markdown in its series, with 6.6% of positions marked down five points or more in a single quarter. It is the quarter in which software became the centre of the private credit conversation, from JPMorgan’s markdown of software loans held as collateral in March to the wider public debate about what AI does to software business models. I want to be careful here. The marks tell me that lenders changed their view of software borrowers. They do not tell me why, or whether lenders are pricing a lasting threat to the revenues of these companies. We also do not know whether the marks reflect the true fundamental risk or overstate it. These are open questions, and our future research can hopefully speak to them.
The largest contributor, but not the whole story
If the rise were only about software, the rest of the book would be flat. It is not. Figure 2 splits the 2.6-point rise by industry group.
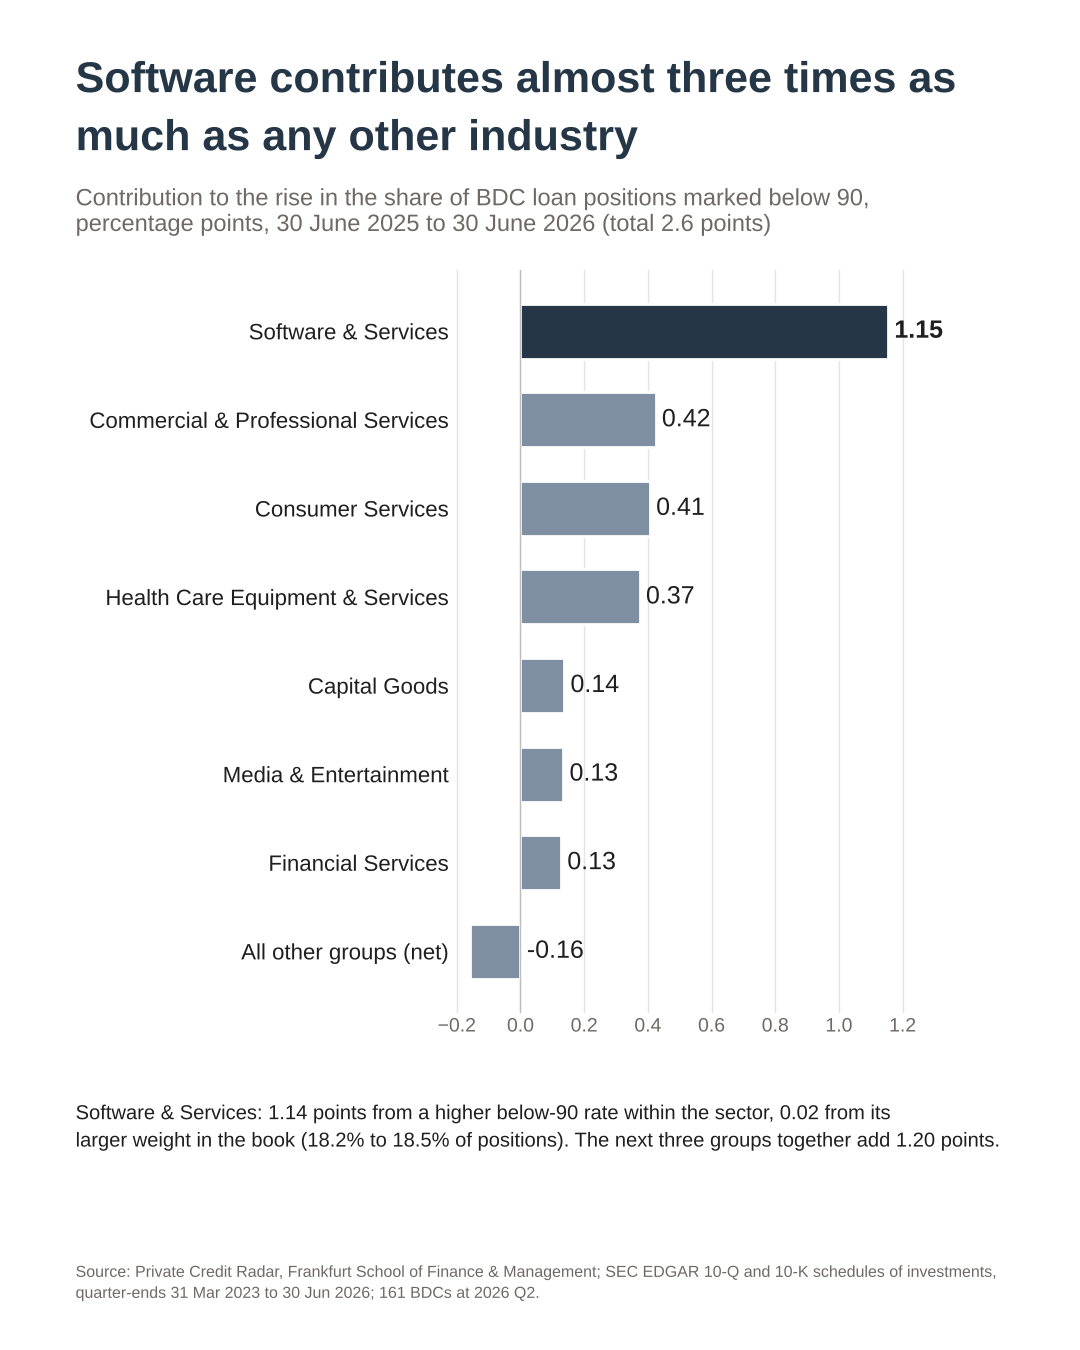
Figure 2. Contribution of each GICS industry group to the rise in the share of BDC loan positions marked below 90, percentage points, 30 June 2025 to 30 June 2026. Source: Private Credit Radar; SEC EDGAR 10-Q and 10-K schedules of investments.
Software’s 1.15 points are almost three times the next industry. Commercial and professional services add 0.42 points, consumer services 0.41 and health care equipment and services 0.37. Capital goods, media and entertainment, and financial services add between 0.13 and 0.14 each. All remaining groups together net out at minus 0.16, so parts of the book did improve.
Read the other way, the three groups behind software add 1.20 points between them, as much as software on its own. Software is the single biggest story in the data. It is not the only one. More than half of the year’s rise in stressed positions came from outside software, and much of it from service businesses of one kind or another.
Counted by company, software has caught up
So far I have counted loan positions. That is how the funds hold the risk, and it is the right count if you are an investor in a BDC. But one company can appear many times in the data: held by several funds, financed in several tranches. The radar gives each borrower one identifier across all funds, which allows a second count, by company. Here a borrower is counted as below 90 when its mark, averaged across all BDCs that hold it and weighted by fair value, is below 90. This company count is an additional cut for this post; it is not one of the radar’s published indicators.
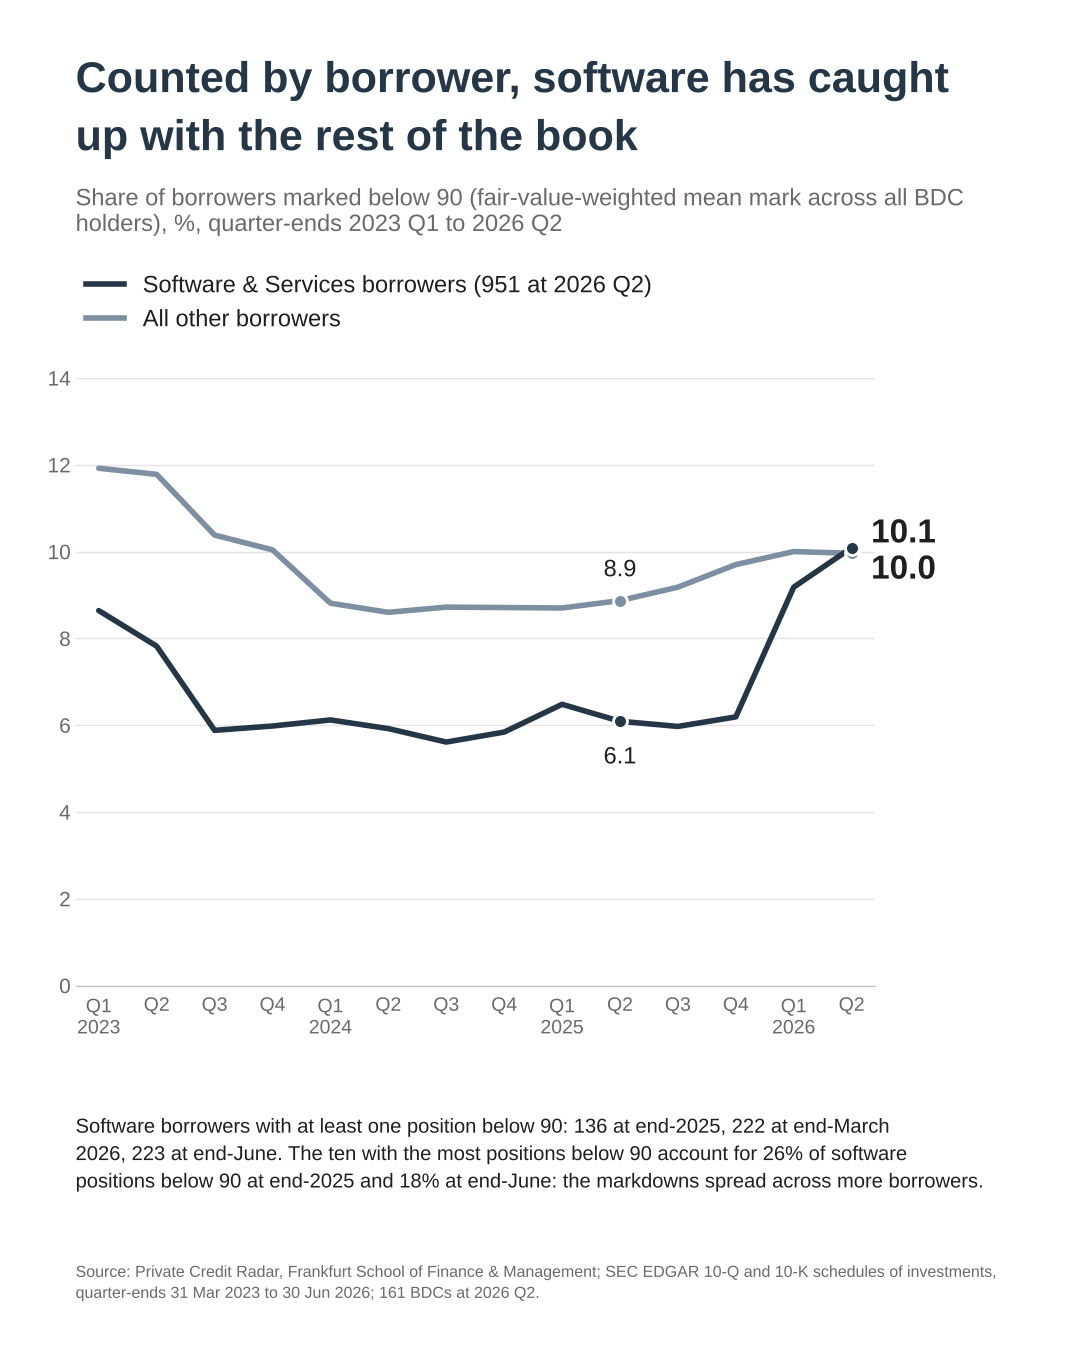
Figure 3. Share of borrowers marked below 90 (fair-value-weighted mean mark across all BDC holders), Software & Services against all other borrowers, quarter-ends 2023 Q1 to 2026 Q2. Source: Private Credit Radar; SEC EDGAR 10-Q and 10-K schedules of investments.
Counted this way, the picture changes. At 30 June 2026 the radar sees 951 software borrowers. A year earlier, 6.1% of them were marked below 90, against 8.9% of all other borrowers. Now it is 10.1% against 10.0%. Software has caught up with the rest of the book. It has not overtaken it.
The two counts together imply something about the stressed software exposure: the software companies marked below 90 carry more positions each than stressed companies elsewhere in the book. Whether that is because more funds hold them or because they are financed in more loans, the counts alone do not tell me. Either way, the investor in a BDC and the observer of the corporate sector see two different numbers; both are right but have different interpretations.
Two further facts from the borrower count shape how I read the year. The first is breadth. The number of software borrowers with a position below 90 rose from 136 at the end of 2025 to 222 at the end of March, then 223 at the end of June. The second is concentration, which fell. At the end of 2025, the ten software borrowers with the most positions below 90 accounted for 26% of all software positions below 90. By the end of June, they accounted for 18%.
That matters. A handful of large problem names is a story about those companies. A markdown that reaches more than two hundred software borrowers, with the biggest names carrying a smaller share of it, looks more like a reassessment of the sector.
What I take from it
None of this is a default story yet. KBRA’s middle-market default monitor stood at 3.6% of borrowers and 2.4% by debt in September 2026. Marks fall before defaults arrive, and a loan marked below 90 can return to par. What the marks show is that lenders have changed their mind about software within a few months, and that they have done so across a broad set of borrowers rather than a few casualties.
Three things follow. First, software is large enough to change the aggregate. At about a fifth of all positions, when its marks deteriorate, the average portfolio quality deteriorates with them. Second, the rise in stress is broader than software. The service industries behind it add as much again, and that is easy to miss if the debate focuses on one sector. Third, how you count matters. By position, software is among the most stressed industries in the book; by company, it is level with the rest. An investor, a supervisor and a lender to the same private credit firm should each know which of the two they are looking at.
On 14 December the Q3 edition rolls the radar to 30 September and adds the European book, the European companies in US BDC portfolios measured with the same indicators. In January 2027 a liquidity flash follows on fund redemptions and liquidity. Release alerts and the indicator series are at privatecreditradar.eu; the series download as a CSV after registration.
A year ago, software was the part of the book lenders worried about least. The marks say that has changed. What they cannot yet say is whether the lenders are right. What we also cannot say is whether the marks are right (or whether the quality is actually even worse than the marks suggest).
Figures: Private Credit Radar, Frankfurt School of Finance & Management; SEC EDGAR 10-Q and 10-K schedules of investments, quarter-ends 31 March 2023 to 30 June 2026; 161 BDCs at 2026 Q2.
private creditPrivate Credit RadarBDCdirect lendingsoftwarevaluation marksindustryfinancial stabilitynonbank financedata